In this tip, we will take a look at the following Tips and Tricks on SSRS Expressions:
Comments are a very useful feature in any kind of coding/programming as they have various benefits like they act as a self-documentation, make it easy to understand and maintain the code. Fortunately, SSRS also allows us to add comments as part of the expressions.
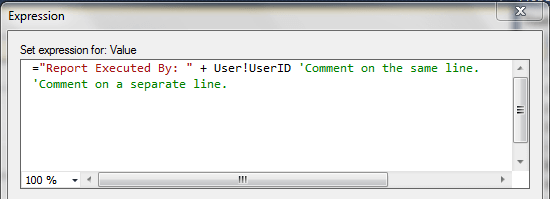
For the purpose of this tip, add a textbox to report header with the following expression in it and preview the report.
Now let's add a comment towards the end of the expression and also on the next line as shown below.
Again preview the report and the output should contain the same text as before: "Report Executed By: <<User Running the Report>>"
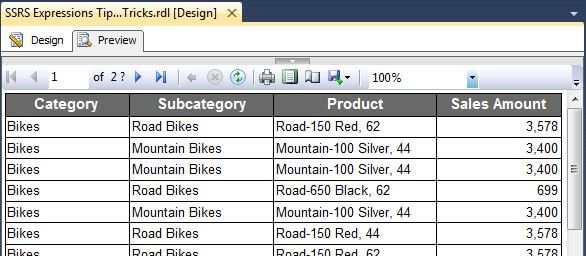
Next, add a Table report item to the designer with four columns as Category, Subcategory, Product, and SalesAmount in the same sequence. The completed report, with some basic formatting, should look as shown below.
Add the following expression in the "Sales Amount" column header.
Add the following expression in the "Sales Amount" column value/detail.
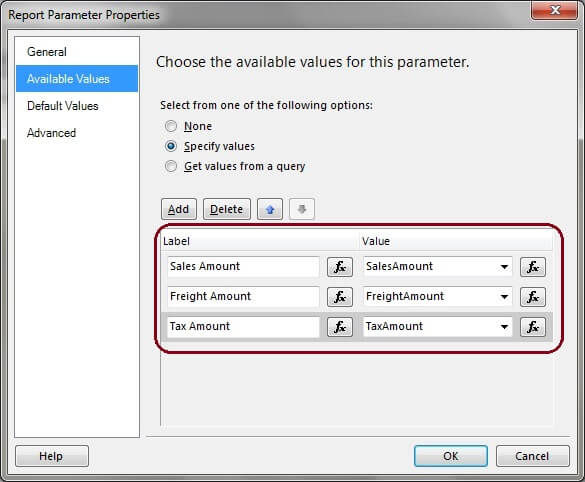
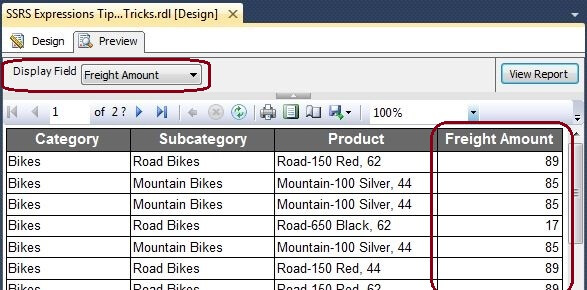
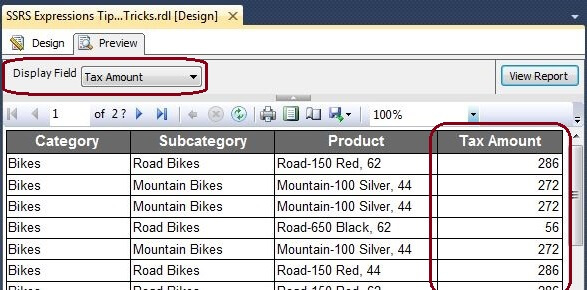
Next render the report with parameter set to "Sales Amount", followed by setting it to "Freight Amount" and finally setting it to "Tax Amount". The output with each of the 3 parameter selections will be as shown below respectively.
Notice that both the value and the label of the last column changed based on the value selected in the "DisplayField" parameter, thereby making the field display dynamicly. Also, note that we have not used any IIF(), SWITCH() or any other conditional statements in this expression. The same technique can be applied for other features within SSRS like the following:
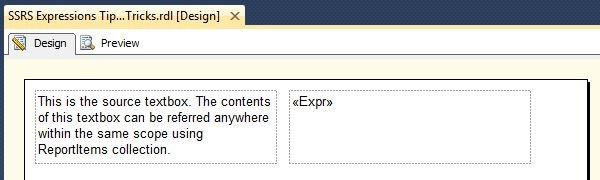
SSRS has a collection called "ReportItems" which allows us to reference values from a Textbox in other places within the report. For the purpose of this demonstration, add two textboxes to report and name them as "tbxSource" and "tbxTarget" respectively.
Add the sample text "This is the source textbox. The contents of this textbox can be referred anywhere within the same scope using ReportItems collection." in the first textbox "tbxSource". And add the following expression in the second textbox "tbxTarget".
The report designer should look like the image shown below.
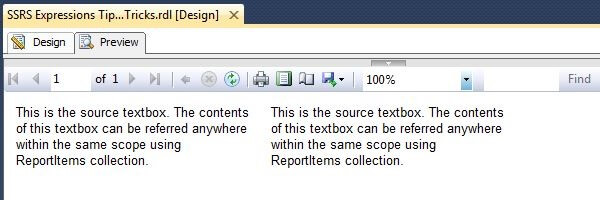
Now preview the report and see that the contents displayed in second textbox "tbxTarget" are exactly the same as that of the contents of the first textbox "tbxSource".
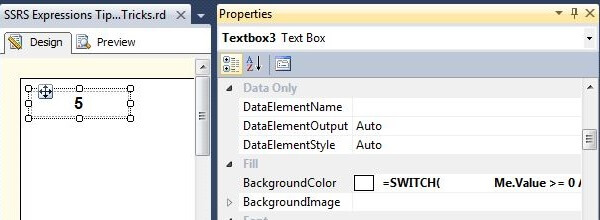
SSRS has interesting syntax to refer to values within the textbox without actually using the expression, field, or parameter present within the textbox. For the purpose of this demonstration, let's add a textbox in the report and put a value 5 in it. Select the properties window and set the "BackgroundColor" property to the following expression.
Your designer window should look as shown below.
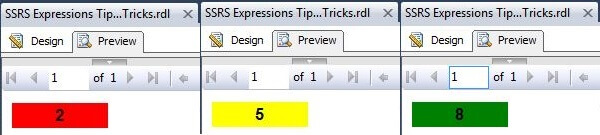
Now preview the report and notice that the textbox background color is "Yellow". Next set the value to "2" and preview it, and notice that the background color is "Red". Finally, set the value to "8" and preview it, and notice that the background color is "Green". The output in each of the scenarios looks like the image as shown below.
In the above textbox, we can put any valid expression instead of a hardcoded number. This feature can be really handy especially at design time when the value in the textbox is a result of an expression.
Often developers use multiple textboxes to display data, which otherwise can be combined into a single textbox by just adding a Line Break. Visual Basic Carriage Return Line Feed (VbCrLf) can be used to add a Line Break in expressions. For the purpose of this demonstration, add a textbox to the designer and then enter the following expression in the textbox.
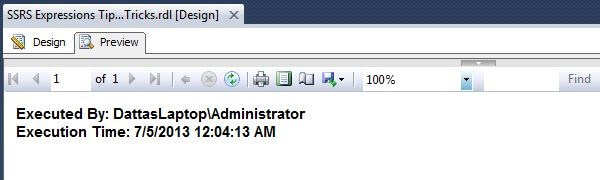
Preview the report and notice that the "Report Executed By" and "Report Execution Time" are on two different lines as shown below.
Line Breaks can be used to combine contents of multiple textboxes placed one after the other and hence make it easy to manage and reduce the effort required for formatting, alignment, etc.
Basically, any valid VB function can be used in SSRS Expressions.
As we can see in this tip, expressions are a very powerful feature of SSRS. Expressions can be used to address many complex problems and reporting requirements.
When working with SQL Server Reporting Services (SSRS) Reports, we often develop multiple reports for the same customer or the same application. In this scenario, it is standard to keep the format/features of all the reports belonging to a particular application or particular customer the same/consistent. And when multiple developers work on each of the different reports, there is a possibility of slight variation in the formatting like fonts, size, padding, alignment, and so on. Now the challenge is, at the enterprise level there might be several departments/developers creating reports, so how do you ensure report layout consistency? Some methods are described here for ensuring consistency across all reports.
SSRS Report Template
When you create a series of reports, you’ll inevitably find report items that are common to all the reports. For example, the header of all reports should have the company logo and address whereas the footer should have other company information or page layout information across all reports in a consistent manner. Creating a template that contains common report items can save you time and eliminate some of the repetition that comes with report writing.
SQL Server Reporting Services (SSRS) allows us to create standard/custom report templates with the desired report layout and use the same custom template every time when creating a new report. With this, you can ensure consistent report layout across departments or the organization.
Creating a custom report template is the same as creating a fresh new report. But this report should be placed at an appropriate location in system so that it will available as a template for other reports. Here a sample design template is given below.
Method 1-Using Code inside SSRS Reports

This template contains execution time, user information and page number information in the footer, while the header contains organization information in report header. The template also has a table, because this template is specially designed for tabular reports. Code for changing the font color and background color of a text box is given below. This code will be placed in the code area of the SSRS Report.
Function AlternateColor(ByVal RowID As String) As String
1
2
3
4
5
6
7
8
9
10
|
If RowID =0 Then
Return "Whitesmoke"
Else
Return "No Color"
End If
End Function
Function HeaderColor() As String
Return "LightGrey"
End Function
|

Now each textbox of table is calling AlternateColor function for change textbox back color.

After completing the design of template layout, we need to place this template at the appropriate location, as shown below. In this example, “3PillarTabulerReportTemplate” has been put in the given location.
For SQL Server 2008 – C:\Program Files (x86)\Microsoft Visual Studio 9.0\Common7\IDE\PrivateAssemblies\ProjectItems\ReportProject
For SQL Server 2012- C:\Program Files (x86)\Microsoft Visual Studio 10.0\Common7\IDE\PrivateAssemblies\ProjectItems\ReportProject
Now this report template will be available when creating a new report in the New Item/Report dialog box.
 Method 2 – Using a Database Table
In the above template, alternate back color for table handled by code of SSRS report. The report theme can be changed easily by changing the code and returning different colors using function. Although, if an organization has created hundreds of reports based on the above template and all reports must be modified manually to change the look and feel, it can be a challenging and time-consuming task.
Here is another method for controlling a report’s look and feel using information from database in the report template.
Create a new table called “ReportStyle” in your SQL Server database. Column information for this table is given below in tabular format. Activestatus columns in the table will notify about active themes for all reports and this is a very important column for controlling look and feel.
| ColumnName | DataType | Description |
| StyleID | Smallint | Primary Key for the table |
| StyleName | varchar(50) | Name of theme/style |
| ReportHeaderForeColor | varchar(50) | Header contecnt forecolor |
| TableHeaderBackColor | varchar(50) | Table header backcolor |
| ToogleRowBackColor1 | varchar(50) | Odd row backcolor |
| ToogleRowBackColor2 | varchar(50) | Even row backclor |
| Activestatus | tinyint | Flag for identify active theme |
Data in the table will look like below. Active status is 1 for “Gray” style by default.

Design the template and add dataset in it using below SQL statement, then define parameter in report and set default value from dataset result as given below.
SELECT TOP 1 ReportHeaderForeColor,
TableHeaderBackColor,
ToogleRowBackColor1,
ToogleRowBackColor2
FROM ReportStyle
WHERE Activestatus=1

In the previous method, table row back color was controlled by code of SSRS report, but in this template, parameter has been filled with background row color. Now set expression in background color property of all textboxes as given below.
=IIf((rownumber(nothing) mod 2)= 1 ,Parameters!ToogleRowBackColor1.Value,Parameters!ToogleRowBackColor2.Value)

Now save the template and put the .rdl file at the appropriate location as given in method 1. Report template will be available when creating a new report in the New Item/Report dialog box.

Here a new tabular report “Table Space Usage Report” has been created using “3PillarTabulerReportTemplateWithStylesheet.” Right now the “Gray” style applied on the report can be seen in the below image.

Now, the active status for “Blue” style has been set to 1, it means blue style is default style for all reports. Re-execute the report and I got different look of this report.


Using the above method, consistency for look and feel, fonts, margins and many more things can be managed in enterprise-level reporting solution. Any changes in look and feel can be deployed in one click and it will be applied on ALL reports, hence manual reformatting of reports is not required. Because all the functionality is encapsulated in SSRS template, developers will not have to worry about color combinations and font settings. It will also reduce development and time of reports.
Custom Template for Report Wizard
Some predefined style templates are in built in to the SSRS report wizard for good look and feel of reports, e.g. Ocean, Generic, Corporate, Slate, etc. Predefined templates are not suitable for our reports, when we think about an organization’s logo color, font preference, etc. in such cases we can also design style according to organization requirements, and can deploy those changes in the system.
The StyleTemplates.xml file can be edit in the C:\Program Files (x86)\Microsoft Visual Studio 10.0\Common7\IDE\PrivateAssemblies\Business Intelligence Wizards\Reports\Styles\en folder, where is the language you are using. This folder is located on the computer on which Report Designer is installed. To modify the styles that are applied through the Report Wizard, edit the file that is in the folder created for the language you are using.
Here, I added a new style “3Pillar” in this template as given below.

Now when we create a new report using Report Wizard then this new style will be available for use.

A report developed using the Report Wizard will look like the below report.
 Report part
A report part is basically a report item that can be used in headers and footers of the custom report template; usage of report part maintains a link and provides an update notification mechanism to all the users of the report part. This means if the report part is updated on the report server and if the reports with that report part are opened, it will notify you about the updated report part. You can choose to keep the existing report part as is or accept/bring the new updated report part into the report, which means it will replace the current report part in the report (for example header or footer) with the latest/updated report part from the server. Now do a practical use of report part in next few paragraphs.
For example, in previous report, header and footer is not available. Adding header and footer in many reports will be time-consuming and will increase chance of inconsistency in different reports. It will be more difficult and time consuming to make little changes in the header because hundreds of reports are waiting for that small change. Really, we should go with approach which can provide consistency across the reports. Here, the new and dynamic approach is the report part. Please note, you can create and publish a report part either in both Business Intelligence Development Studio Report Designer or in Report Builder 3.0, but you can only search and use it in Report Builder 3.0. But still it is a powerful option for developers.
Open any report from report manager which has header and footer in it. Go to menu and click on the Publish Report Parts menu item as shown below; you need to be connected to the report server to publish the report part. You can change the report server URL and location to publish the report part by going to Options.

Now select ReportHeader and ReportFooter report parts, you can click on the Publish button on the above screen to start the publishing. The result of this will be displayed on the Results area. By default report parts are deployed on the Report Parts folder on the connected report server, which can be changed by browsing to a new location.

Now open existing report to use ReportHeader and ReportFoooter report parts in your report, simply drag it from the Report Part Gallery to appropriate report area.

Publish report on report server. Execute report and see the result, header and footer has been applied on report. Now again one interesting thing of Report Part, due to this amazing functionality, many developer like report part. If the new version of report part is available then it will notify to use latest, when developer open reports in report builder as display in below image. It is the choice of the developer to use the latest version or stay with the old one. Again good for ensure consistency.

Choosing and installing
SQL Server Reporting Services (SSRS) is only the first step in satisfying the bevy of report consumers in your organization. Now, you need to produce dazzling reports that use advanced features for displaying data in the myriad ways users want—and still get your other work done. Here are some tips and tricks for efficiently creating valuable, flexible reports that perform well, plus a sampling of some third-party tools you can use to extend SSRS's functionality.
Creating a Report Template
When you create a series of reports, you'll inevitably find report items that are common to all the reports, such as the report header, an image, a page count in the footer, or even a parameter. Creating a template that contains a skeleton of common report items can save you time and eliminate some of the repetition that comes with report writing.
To create a report template, add a new report to your report server project in SQL Server Business Intelligence Development Studio (BIDS). Using the Report Designer, place all the common report items in the report. Then, give the report a name such as myReportBasedOnATemplate to indicate it's a template, as
Figure 1 shows, and save the Report Definition Language (RDL) file to C:\Program Files\Microsoft Visual Studio 8\Common7\IDE\PrivateAssemblies ProjectItems\ReportProject. Your template file will now appear in the
Visual Studio installed templates list when you add a new report to your project, and the new report will contain all the common items defined in your template.
If you're a fan of the Report Designer's Report Wizard, which guides you through the report-creation process, you can add your own report styles to the Report Wizard. Simply edit the StyleTemplates.xml file located in the directory C:\Program Files\Microsoft Visual Studio 8\Common7\IDE\PrivateAssembliesBusiness Intelligence Wizards\Reports\Styles.
Using Custom Assemblies
SSRS lets you apply simple conditions to different report items (e.g., values, formatting, styles) by using expressions and report-level custom code blocks.
However, when writing complex logic or sharing functions across multiple reports, it's best to write the functionality as a custom code assembly that you reference from your report. By placing common custom functions, such as special calculations in a Microsoft .NET assembly, you gain the full power of .NET, better debugging capabilities compared with the Visual Basic (VB) expressions embedded in a report, and the ability to maintain your functions in a single spot rather than across multiple reports. Additionally, report expressions are limited to a subset of Visual Basic .NET (VB.NET), while custom assemblies can leverage either C# or VB.NET.
You reference the custom assembly from your report by using the References Tab in the Report Properties dialog box. Alternatively, you can place the assembly reference in a report template file so that the functions in your assembly are available to all reports that are based on your template. After you place the reference in the template, you can reference the functions in your assembly as you would any report-level code block—for example, by using a reference such as =Code.myAssemblyFunction().
When using custom assemblies, make sure you understand how to modify Code Access Security (CAS) in the SSRS policy configurations file so that you can execute the assemblies. CAS bases security on code, instead of users, so that you can appropriately secure expressions, code blocks, and assemblies that your reports use. (For details about SSRS and CAS policies. You also need to mark your custom assembly asAllowPartiallyTrustedCallersAttribute, which will remove any implicit LinkDemands on your assembly and allow code execution.
Adding Fields to Page Headers and Footers
You might want your report's page header to include more than just an image and a title. For example, you might want to add an employee ID or some other database field value to the page header. However, if you've ever tried to add a field from a data set to the page header, you know that SSRS rejects the action. But there's a workaround: Place the field value in an item in the body of the report, then refer to that report item in the header (for example, =ReportItem!txtFie ldValue.Value).
This solution has one catch: If your header appears on each page, the report body field that you reference in the header needs to appear on each page as well. Also, make sure the field repeats with each page break in either HTML or PDF rendering; otherwise, the field won't appear in the header. Note that this tip also works for adding fields to a report's page footer.
Setting Page Sizes
Despite the hype of the paperless office, users print reports. Because most users export reports to PDF if they're going to be printed or emailed, it's a good idea to plan the size and orientation of the report in advance so that it's printer friendly.
The items placed on a report often dictate size and orientation, but you can define page size to optimize viewing reports rendered in different formats. To set the report size for a report rendered as PDF, for example, use the PageSize property settings. For HTML viewing, specify InteractiveSize property settings. Both PageSize and InteractiveSize are properties of the Report object and appear in the Properties window. Setting the interactive page size will expand the visible report size within the browser but won't affect the report size when it's rendered in other formats, such as PDF. Remember, even if the HTML version of the report doesn't have any page breaks, the PDF version likely will have them. When setting the report size, note that SSRS defines by default a 1-inch margin on all four sides of a report, which is generally more than most reports need and eats into valuable report space.
Boosting Productivity and Performance
It's fairly easy to write a query to fetch data for a report, display the data in one of the various report controls, and deploy the report to users. But what happens when even the best-written query takes too long and slow report performance begins to irritate users? There's no panacea for a poorly written query, but the following SSRS tricks can improve the overall performance of your reports.
Use snapshots to avoid bottlenecks. You can avoid the bottlenecks of long-running reports by creating a report snapshot to run nightly or during periods of low activity on your system. A snapshot automatically runs the report based on a defined schedule and stores the results in the report server database. You can then render reports from the snapshot instead of from the production database, easing the burden on your server.
If you want to enable report users to filter results from the snapshots, you need to design the report so that it uses report filters rather than a query parameter. A snapshot runs for one set of query parameters (if present), and if those values change when a user executes the report, the snapshot will be invalid. I discuss report filters a little later.
Define pagination to hide overhead. For reports returning a large number of records for display in a table or list, you can use page-breaking pagination to hide much of the processing overhead from the user. Several report controls feature properties for inserting page breaks before or after the control or before or after groups within the control. For example, if a user requests a report that returns 1000 rows of data, you can use page breaking to render the initial page of results while the report server renders the rest of the pages in the background. Without pagination, the user would have to wait to view the report until SSRS had rendered all 1000 rows.
Implement filters for performance. As noted earlier, if you use report-level filtering on data regions and data groupings rather than using query parameters as filters, SSRS can filter results from an execution snapshot, saving you a trip to the production database to collect report data. When you use a query parameter as a filter, SSRS passes the report parameter value to the query that generates the data set so that the query can perform the filtering. In contrast, when you use a filter on a data region, for example, the report parameter value is implemented through an expression on the data region's Filters tab, as
Figure 2 shows. To see how to add filters, read the Microsoft article "
How-to: Add a Filter (Report Designer)."
Enable drilldowns for detail. Instead of giving users a report that shows all the data at once, design a summary report that presents a subset of data and let users drill down to get more detail. Such a report design—using master detail reports that take advantage of SSRS's navigation capabilities—lets individual users dig deeper into data they're interested inwhile avoiding returning huge reports to everyone. Many parts of a report control have a Navigation property, which you can use, for example, to create a hyperlink on the control for passing specific values, as
Figure 3 shows, or to navigate to another report.
Use rectangles for consistency and efficiency. Consider grouping report items in rectangles for more controlled and consistent formatting and easy object movement. With this strategy, you can hide several items at once and in one place, you can place multiple text boxes contained in a rectangle into a single table cell, and you have more pagination options. Place report items inside a rectangle by dragging and dropping or cutting and pasting them. To verify that an item is inside the rectangle, check the report item's Parent property.
Refresh data sets. When a stored procedure, view, or query on which a report is based changes, you must update the report data set to reflect the changes. You can re-execute the data set to update it by clicking the exclamation mark on the Dataset toolbar. Then, click the data set Refresh button on the Dataset toolbar. The refresh operation will use any parameters entered during the execution and will add or remove any fields or parameters changed in the underlying procedure, view, or query. This process automatically discovers any changes, eliminating the need to change parameters on both the Report menu and the Dataset dialog box.
Take advantage of free reports. Microsoft provides many free SSRS code samples, including valuable Report Packs that give you predefined reports for reporting against Microsoft IIS, SQL Server Integration Services (SSIS), Exchange Server, Windows SharePoint Services, Great Plains, and other Microsoft applications. Report Packs are not only useful out of the box, but also serve as examples for how to build your own custom reports.
You can find another set of free reports in the SSRS samples, including easy-to-install execution log reports that show report-log activity in your environment. The execution log reports require you to create a small database and SSIS package (provided in the sample) to hold execution data. The 11 SSRS samples include reports such as the must-have Average Report Execution Time, Longest Running Reports, and Reports By Month.
Embed basic JavaScript code in a report. You won't find this tip in any Microsoft documentation, but a few lines of JavaScript code can enhance report interactivity. Using the expression ="javascript:history.back()" in a text box provides a handy Back button, for example, and ="javascript:void(window. open('url'))" lets you open a link without leaving a report.
Implement dynamic images for a scorecard feel. Report consumers love colorful reports, and including images is a great way to add pizzazz and highlight important values on a report. Conditionally presenting images, such as a stoplight for a value out of range or a check mark for a value that meets or exceeds expectations, is a valuable way to communicate information to users and give your report a "scorecard" feel. You can conditionally show or hide an image by using expressions for the image's Visibility: Hidden property.
Display selected parameter values in the report header. If you've ever looked at a report after you've exported it to PDF (or any other rendering format), you understand the importance of displaying certain parameter values in the report header. Without being able to see the built-in or custom parameter selections, a report consumer has no idea what the parameters were when the report was run. You can prevent user headaches by placing expressions (such as =Parameters!ParamName.Value or =Join(Parameters!MultiParamName.Value, ", ") in a few text boxes in the page header to show which multiselect report parameter values were selected when the report was executed.
Use dynamic grouping for control. Although you can't control everything on a report by using expressions, you can control grouping this way. In some cases, you can even avoid writing an additional report by using expression-based grouping. For example, you could use expressions to design a report that features a grouping on Region and let users drill down on the value for a specific region. You can use the same design technique to then let users drill down on values for specific sites in that region. Just set up a parameter called GeoGroup and give it unique values such as RegionID and SiteID, as
Figure 4 shows. In the data region, set your grouping to the expression =Fields(Parameters!GeoGroup. Value).Value, as
Figure 5 shows. Now the data region's grouping is parameter-based, making the report reusable and more flexible.
Go further with ReportViewer controls. Many SSRS implementations don't go beyond deploying a report to the Web and giving users a URL for access. But for developers who want to create customized parameter selection or integrate reports into an existing application, the Visual Studio 2005 ReportViewer controls are the place to start. There are two freely redistributable ReportViewer controls: one for Web applications and one for Windows applications. You can configure both controls to run in remote mode (which retrieves and displays reports from the report server) or local mode (which processes a report based on an .rdlc file deployed directly on the client). An advanced feature of the ReportViewer controls is the ability to consume a DataTable or public properties on enumerable objects such as the report's DataSource.
Details about ReportViewer controls.
Tapping Into Third-Party Tools
SSRS is still a relatively new product, but it leverages the open RDL standard for defining reports. As the product matures, more third-party vendors will offer tools that support and extend its functionality. Here is a sampling of tools that already can enhance your SSRS reports and offer additional functionality.
OfficeWriter. If you've worked much with SSRS, you've probably had report consumers ask if they can export a report to Microsoft Word or add a formula when they export a report to Microsoft Excel. You currently can't perform these functions with SSRS, but you can with
Software Artisan's OfficeWriter. OfficeWriter creates templates that let you export SSRS reports to either Word or Excel,while preserving the functionality of a true Word or Excel document.
OfficeWriter also lets end users write reports from within Word or Excel (without using Visual Studio) and publish the resulting RDL file to the report server.
Dundas controls. Dundas software now supplies advanced controls for SSRS. The Dundas Chart for Reporting Services includes advanced chart visualizations and additional chart types and statistical formulas. If you're going to do more than basic charting or want your charts to stand out, Dundas Chart for Reporting Services is the way to go. Dundas also offers three other components for SSRS: Dundas Gauge, which adds dashboard and scorecarding features to reports; Dundas Calendar, which adds date-related visualization elements; and Dundas Map, which adds map visualization features.
SSRS Can Fit Your Needs
Because reporting is a key task in every organization, SSRS is a very useful tool.SSRS is designed to help you quickly and efficiently develop and deploy reports, but the more product experience and knowledge you have, the more value you can deliver to your users. You'll soon begin collecting your own SSRS tips and tricks and developing workarounds to fit your needs.
I have recently been sharpening up on my SSRS skills and I have decided to take time to share what I feel are some valuable tips and tricks.
This is a large list but can serve as a great resource to refresh your memory before starting any SSRS project.
General Design Tips:
1. Always use views or stored procedures for data sets. This can allow reports to continue to run properly even if a field is added to and underlying data source. Additional fields can also be added into a view easily without having to make changes to underlying tables as well.
2. Use calculations within the report when you don’t have access to create data structures in the database (i.e. stored procedures).
3. Make sure to set the "NoRows" properties for all data regions. This will return a message to the user if no data is returned when executing the report.
4. If you plan to use an existing dataset when creating a new report, rather than starting with a blank report, copy an existing report, and delete the data regions from it. This can help preserve the appearance of the other reports (especially if standard colors, layouts, and logos are used) and minimize the effort when starting a new report.
5. Properties that can be formatted with four values (2,2,2,2) read from left to right, then top to bottom (Left, Right, Top, Bottom).
6. Even if the report only has one dataset, it is good practice to always define the dataset when referencing fields in case more datasets are added at a later time. This will save some rework.
7. Always name all objects and items within the report. This makes debugging easier. Naming objects as you create them will save a lot of time later in the testing process.
Advanced Report Authoring:
1. Lists can become very powerful by simply inserting other data regions (i.e. graphs, tables, matrices, and other lists) into the list itself. The list can then be grouped by a dimension to dynamically display the data. However, keep in mind that lists can only use data regions from the same dataset.
2. In a matrix, if you want some data columns to appear before the column groupings use an integer value in the "GroupsBeforeRowHeaders" property.
3. Create separate datasets for filters, these should be two column tables (one row for the value, one row for the label). A parameter must be created to use the data from the dataset.
4. Parameters can be used to dynamically control formats, they can be used within the dataset queries to control the data returned, and also within filters (two column datasets as mentioned in the previous tip).
5. A filter returns the full dataset then filters the data, a parameter in a query limits the dataset that is returned. Filters can be applied to single data regions and still allow other regions to use the full dataset. It can be important to note when and how the data is filtered when trying to fix / prevent performance issues.
6. If a report action (i.e. text which hides and / or displays a sub report) for an item is defined try to remember to underline it. This is always a good idea because it can inform the user that an action is available.
7. To display sub reports correctly you must provide a value for all parameters of the sub report for it to render without error.
8. Recursive relationships (employee to manager) have a whole set of Recursive logic that can be applied in order to create calculations. If you want a parent row’s value aggregated with the lower levels, simply use an aggregation with the Recursive keyword.
Working with Report Models:
1. A report model contains a hierarchy of objects whose purpose is to represent the data structures and relationships in business terms. It is used to hide the complexities of data structures to the end users.
2. The data source for a report model project can use the SQL Server provider only. A report model can only use one data source.
3. Report Models can also be created from Management Studio and Report Manager.
4. Just like in SSAS, named queries and named calculations can be used within the data source view for a Report Model.
5. Fact tables must have a logical key in the Report Model in order to include it as an entity, this can be a composite key of all foreign keys in the table.
6. You should plan to go through several cycles of fine-tuning your report models as users get more experience working with Report Builder (an iterative development approach).
Introduction
Expressions are a very powerful feature of SSRS. They enable us to show fields at run time depending on conditions. Generally expressions are written in Visual Basic and there are many built-in functions provided. We can have also custom code for expressions. Expressions begin with an equal sign (=). In this article, I will explain some of the tips and tricks when working with expressions.
Tip 1: Display column dynamically
Using an expression we are also able to show a report column dynamically. Suppose my dataset has fields like EmployeeId, name, code, address, phone and email. I have created a report using this dataset and within the report I want to show employeeId, Code and Name by default and the basic report format looks as shown below.

In the last column, the report will show Address, phone or email depending on the parameter (“Show field” in the preceding image).
The Parameter definition is as shown in the following.

As the solution, add the following expression in the last column header.

Add the following expression in the "last column value/detail".
=Switch(Parameters!dyamicfiled.Value="Address",
Fields!Address.Value,Parameters!dyamicfiled.Value="Phone",
Fields!Phone.Value,Parameters!dyamicfiled.Value="Email",
Fields!Email.Value)

Now, render the report with the parameter set to "Address" and then "Phone" and then "Email". The output with each parameter selection is as shown below.

Here, both the header and details fields of the last column are changed based on the parameter value selection. We can use IIF or any other conditional statement instead of switch.
Tip 2: Adding Comments in Expressions
As we know, comments are useful as self-documentation and make it easy to understand and maintain the code. SSRS allows us to provide comments as part of an expression.
To show this, I have added one text box to the report and used the following expression in it.
 Output:
 The report output should contain the following text: "You are select show filed value:".

The following point needs to be considered before using a comment in the expression.
- The Comment must implemented with a single quote.
- A Comment can be added in the same line or the next line within an expression.
- Comments cannot be added in the beginning or middle of the expression.
- No concept of multi-line comments like C#.
Tip 3: Referring to data from another container content Report Items allow us to reference a value from a TextBox in another TextBox in another part of the same report. The SSRS report Items collection is a good feature and could be used in various scenarios. In the following example, I have copied the text data from one text to another text box of a report.
 Output:
 Tip 4: Referring to Contents within Textboxes
We can insert a value into a text box without using an expression, field or parameter present within the TextBox. In the following example I show that when the value of a text box can change the background color of the text box will change.

Here I am using a hard-coded value. We can also get the value from a parameter, another expression or from the field instead of this hardcoded value.
Output
 Tip 5: Visual Basic function
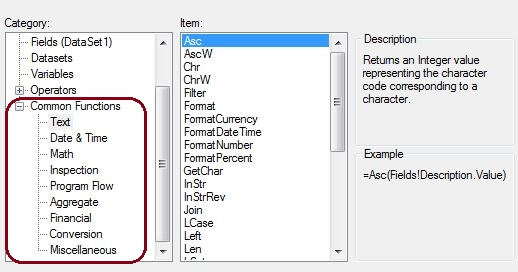
SSRS allows us to use Visual Basic functions in expressions. There are many categories of functions available with SSRS.

This is a very powerful feature. Basically any valid VB function can be used in a report expression.
Tip 6: Adding a Line Break in SSRS Expressions
Developers use multiple text boxes to show multiline data otherwise a single TextBox can be used with just a line break. The VbCRLf (Visual Basic Carriage Return Line Feed) value can be used to add a line break in expressions. To show the VbCRLf function, I have added one text box to the report to provide the following expression in the TextBox.
Output: On Preview the report "This is my test" and "Report Execution Time" are on two different lines as shown below.

Expressions are a very useful feature of SSRS and they can be used to address many complex problems and reporting requirements.